Results from FPPA’s Recent Employer Survey

Biennial survey helps gauge employer satisfaction with FPPA's processes

When comparing FPPA’s mission to that of our Employers, there is a significant overlap in our focus on serving Colorado’s first responders. But that’s not to say that looking after our members’ financial wellbeing is our singular objective… we care about all of our partners who help us provide retirement security to public safety officers across our state.
That is why, in addition to regularly gauging our members’ satisfaction with FPPA, we send out a biennial survey to our employers to similarly determine what we’re doing well and where there’s room for improvement.
With this goal in mind, FPPA employers received several inquiries this spring from a third party data gathering and analysis firm, asking them to complete a short survey regarding their relationship with FPPA. In this case, we elected to use a third-party partner to compile and analyze data for the survey, in the hopes that it would generate the most honest and unbiased results possible.
Before we share the results, let us first say thank you to all of the employer contacts who took the time to complete the survey. Hearing back from you in this context, while not required, is incredibly helpful to FPPA staff as we work to improve our processes and provide excellent service to our members and employers.
And with that, let’s roll out the findings:
Results from FPPA’s biennial employer survey
Who we surveyed
To gather a data set that was as representative as possible, we reached out to all of our employer contacts, just over 1,200 individuals. Each contact received three requests to complete the survey, and in the end just over 300 employer contacts responded, or about 25% of those we contacted.
Responses came in from 55 of Colorado’s 64 counties (86%), with the largest share coming from… Weld County, contributing a full 10% of responses. Shout out to Weld County for all the valuable feedback!
Broken down by department type, fire department employers represented 72% of responses to 43% working in police departments. This indicates that a healthy proportion of respondents work with both firefighter and police officer members.
What questions did we ask?
The survey was made up of 26 questions. Topics ranged from satisfaction with FPPA staff to on- and off-line resources offered to employers via the Employer Portal at FPPAco.org.
What we learned from this year’s survey
Thanks to the large volume of responses to this year’s survey, we were able to draw some helpful conclusions and generate some valuable ideas for improvement. Here are just a few that we found particularly interesting.
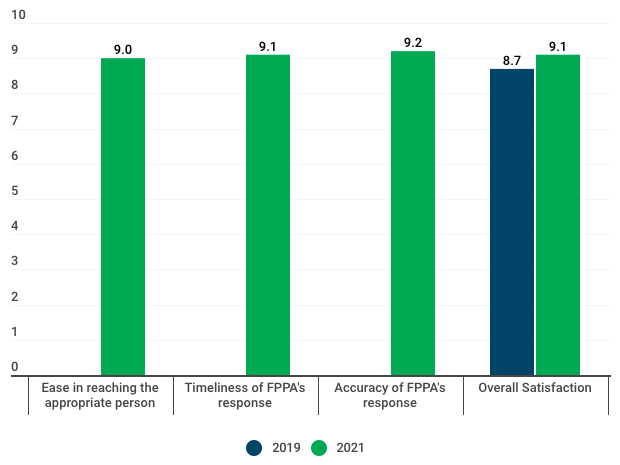
Employers and FPPA staff have something special going on
When asked about the working relationship with their counterpart on FPPA’s staff, employers overwhelmingly indicated that they were satisfied with our team. On a ten-point scale (where ten is best), employers rated things like Ease of reaching the appropriate person (9.0) and Accuracy of FPPA’s response to questions (9.2) quite highly.
Employers do not want to talk on the phone (was it something we said?)

Asked how they want to receive information from FPPA, employers overwhelmingly said they want to hear from us by email. To be sure, the fact the email was the top response is not surprising, as it’s still the most widely used communication tool in business, but the surprising bit was just how lopsided the results were.
As you can see, email was the preferred communication method for 93% of respondents, dwarfing the rest of the top 5 (and let’s not even talk about the next five, which included this very blog). But, rather than disconnect our phone lines and move permanently into the internet, let me just remind everyone that our team is readily available to chat the old fashioned way at (303) 770-3772. Bonus: our primary phone answerer, Coco, is one of the most pleasant individuals you’ll ever have the pleasure of interacting with.
We’re doing a good job of providing resources, but there’s room for improvement
In this survey, respondents gave FPPA’s Employer Portal generally high marks for tasks like setting up new employees and reporting salaries:

Some employers, however, expressed frustrations with things like slow load times navigation/difficulty finding information. These suggest possible areas where FPPA could improve some of our processes, and are things we will certainly look into.
Once again, thank you to all of our employers who participated in this year’s survey. Thanks to your thoughtful feedback, we learned that we have much to be proud of, but also a few items to work on to better serve our stakeholders. It is with this in mind that we’ll continue to strive towards being strong partners in our shared goal of serving FPPA’s members.
Do you have any feedback to help FPPA improve our processes? Please contact us!